My "6 days out" predictions for the 2022 US midterm elections

OVERALL:
- Dem Senate control -- Unclear but slight no (49% chance)
- Dem House control -- Somewhat leaning no (33% chance)
BALANCE OF POWER:
- D House + D Senate: Somewhat leaning no (26% chance)
- R House + D Senate: Somewhat leaning no (23% chance)
- D House + R Senate: Likely no (7% chance)
- R House + R Senate: Unclear but slight no (42% chance)
MAPS:
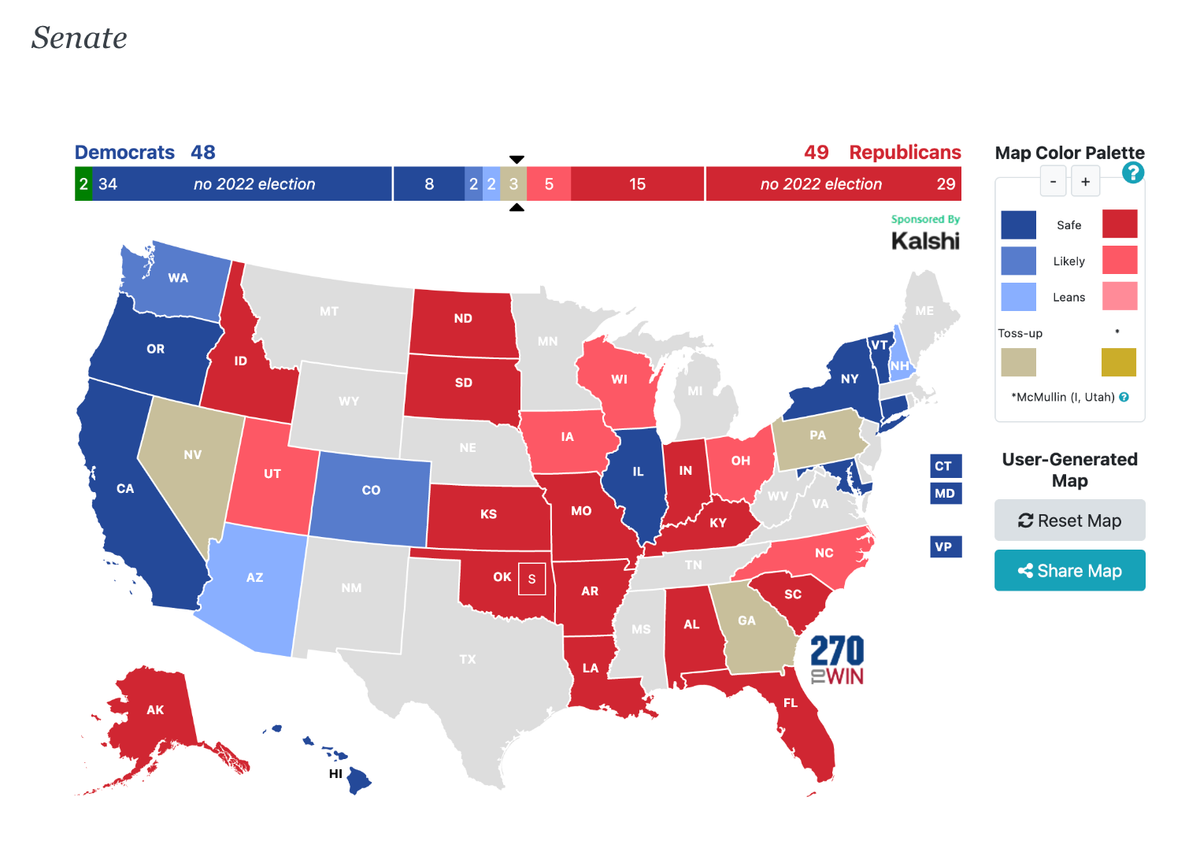
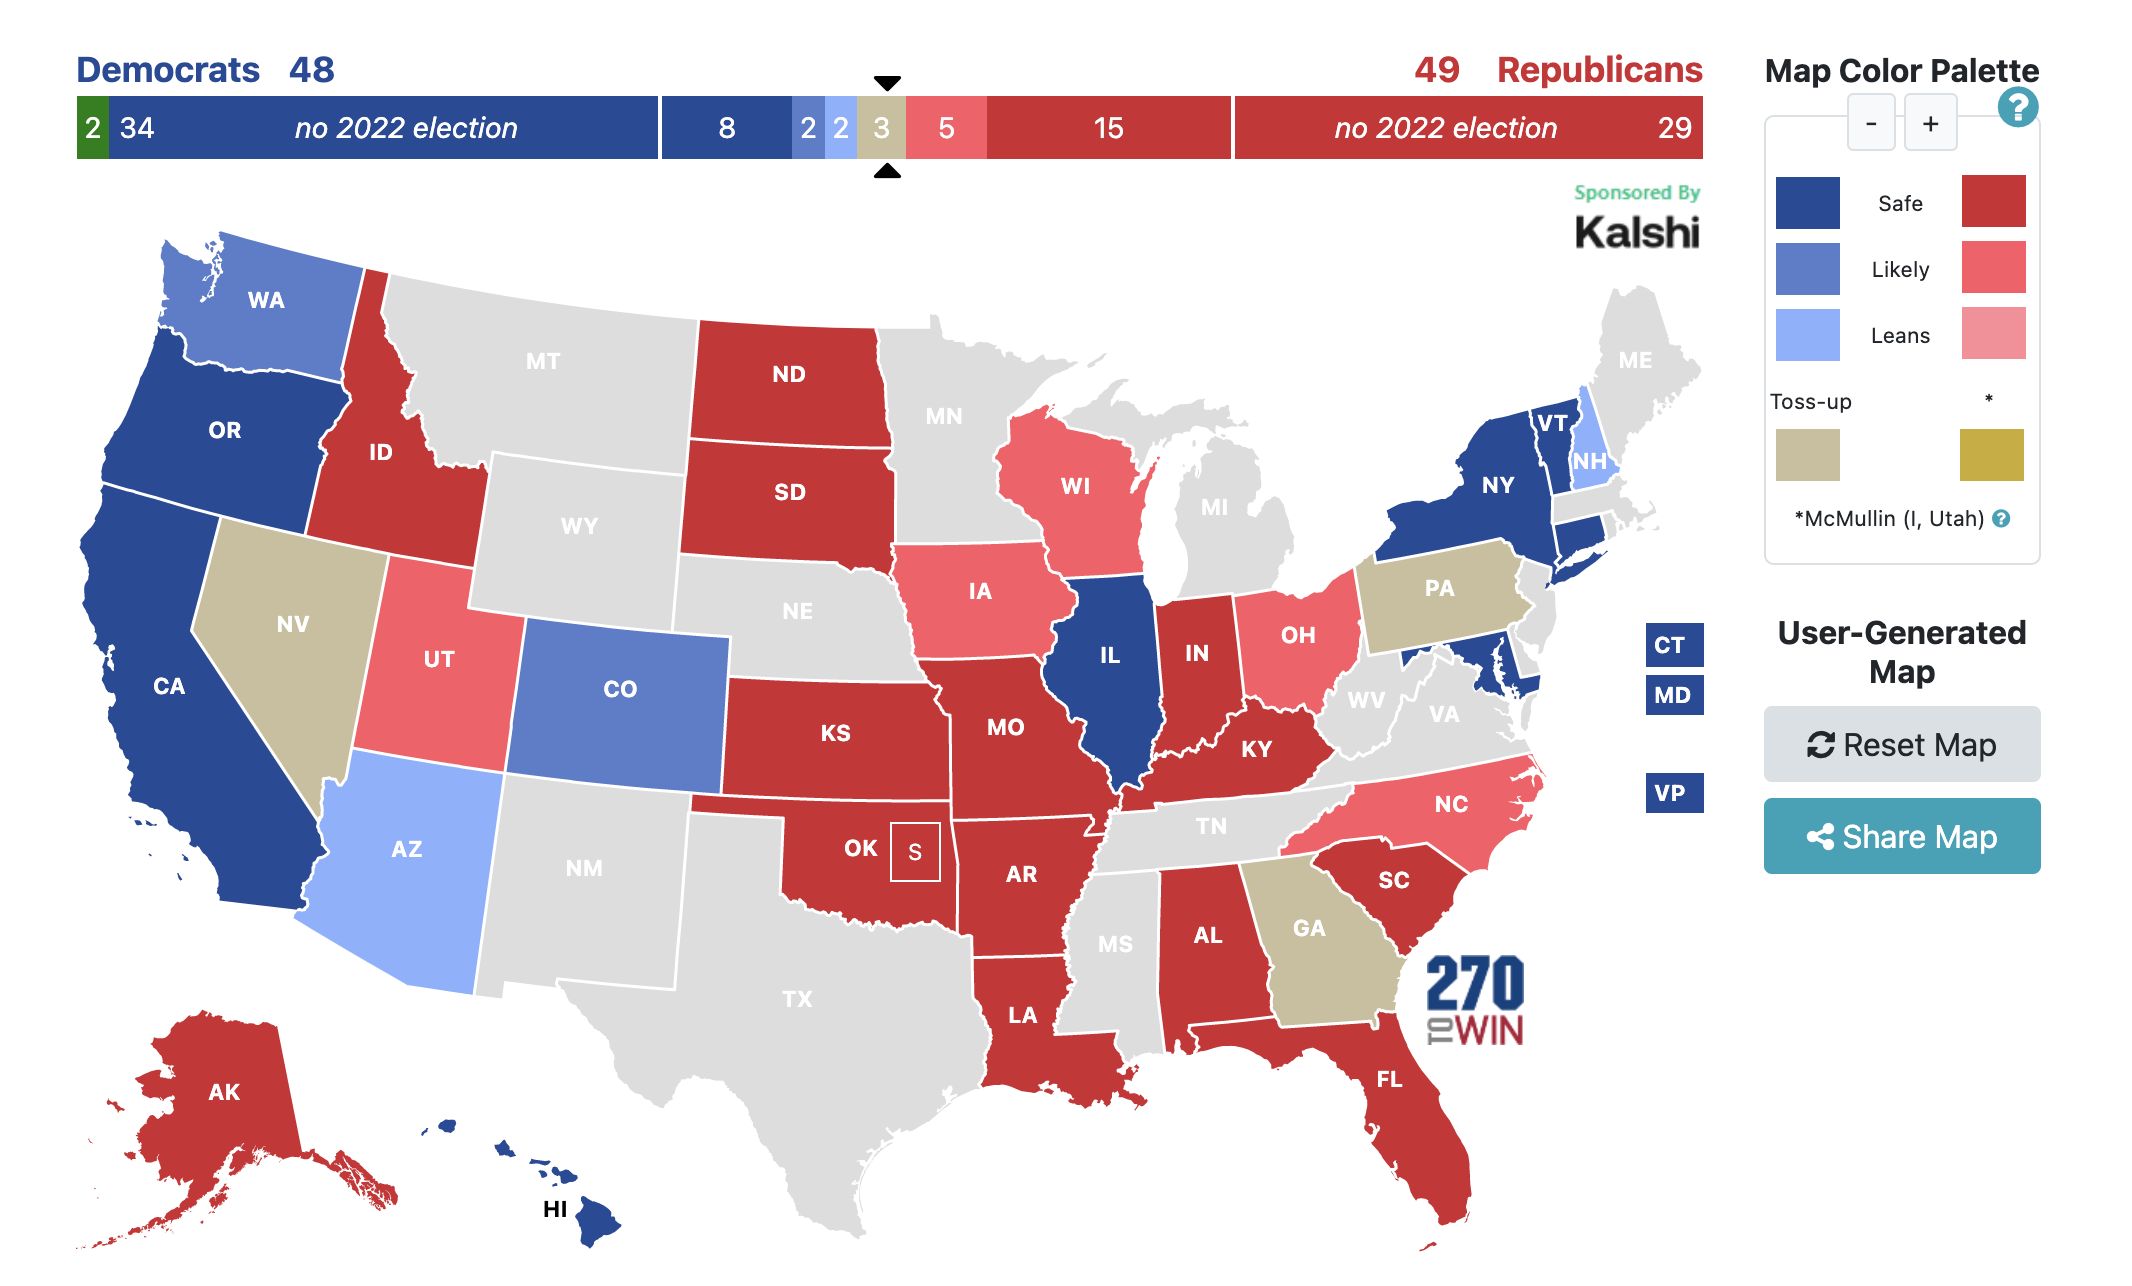
Senate
Governor
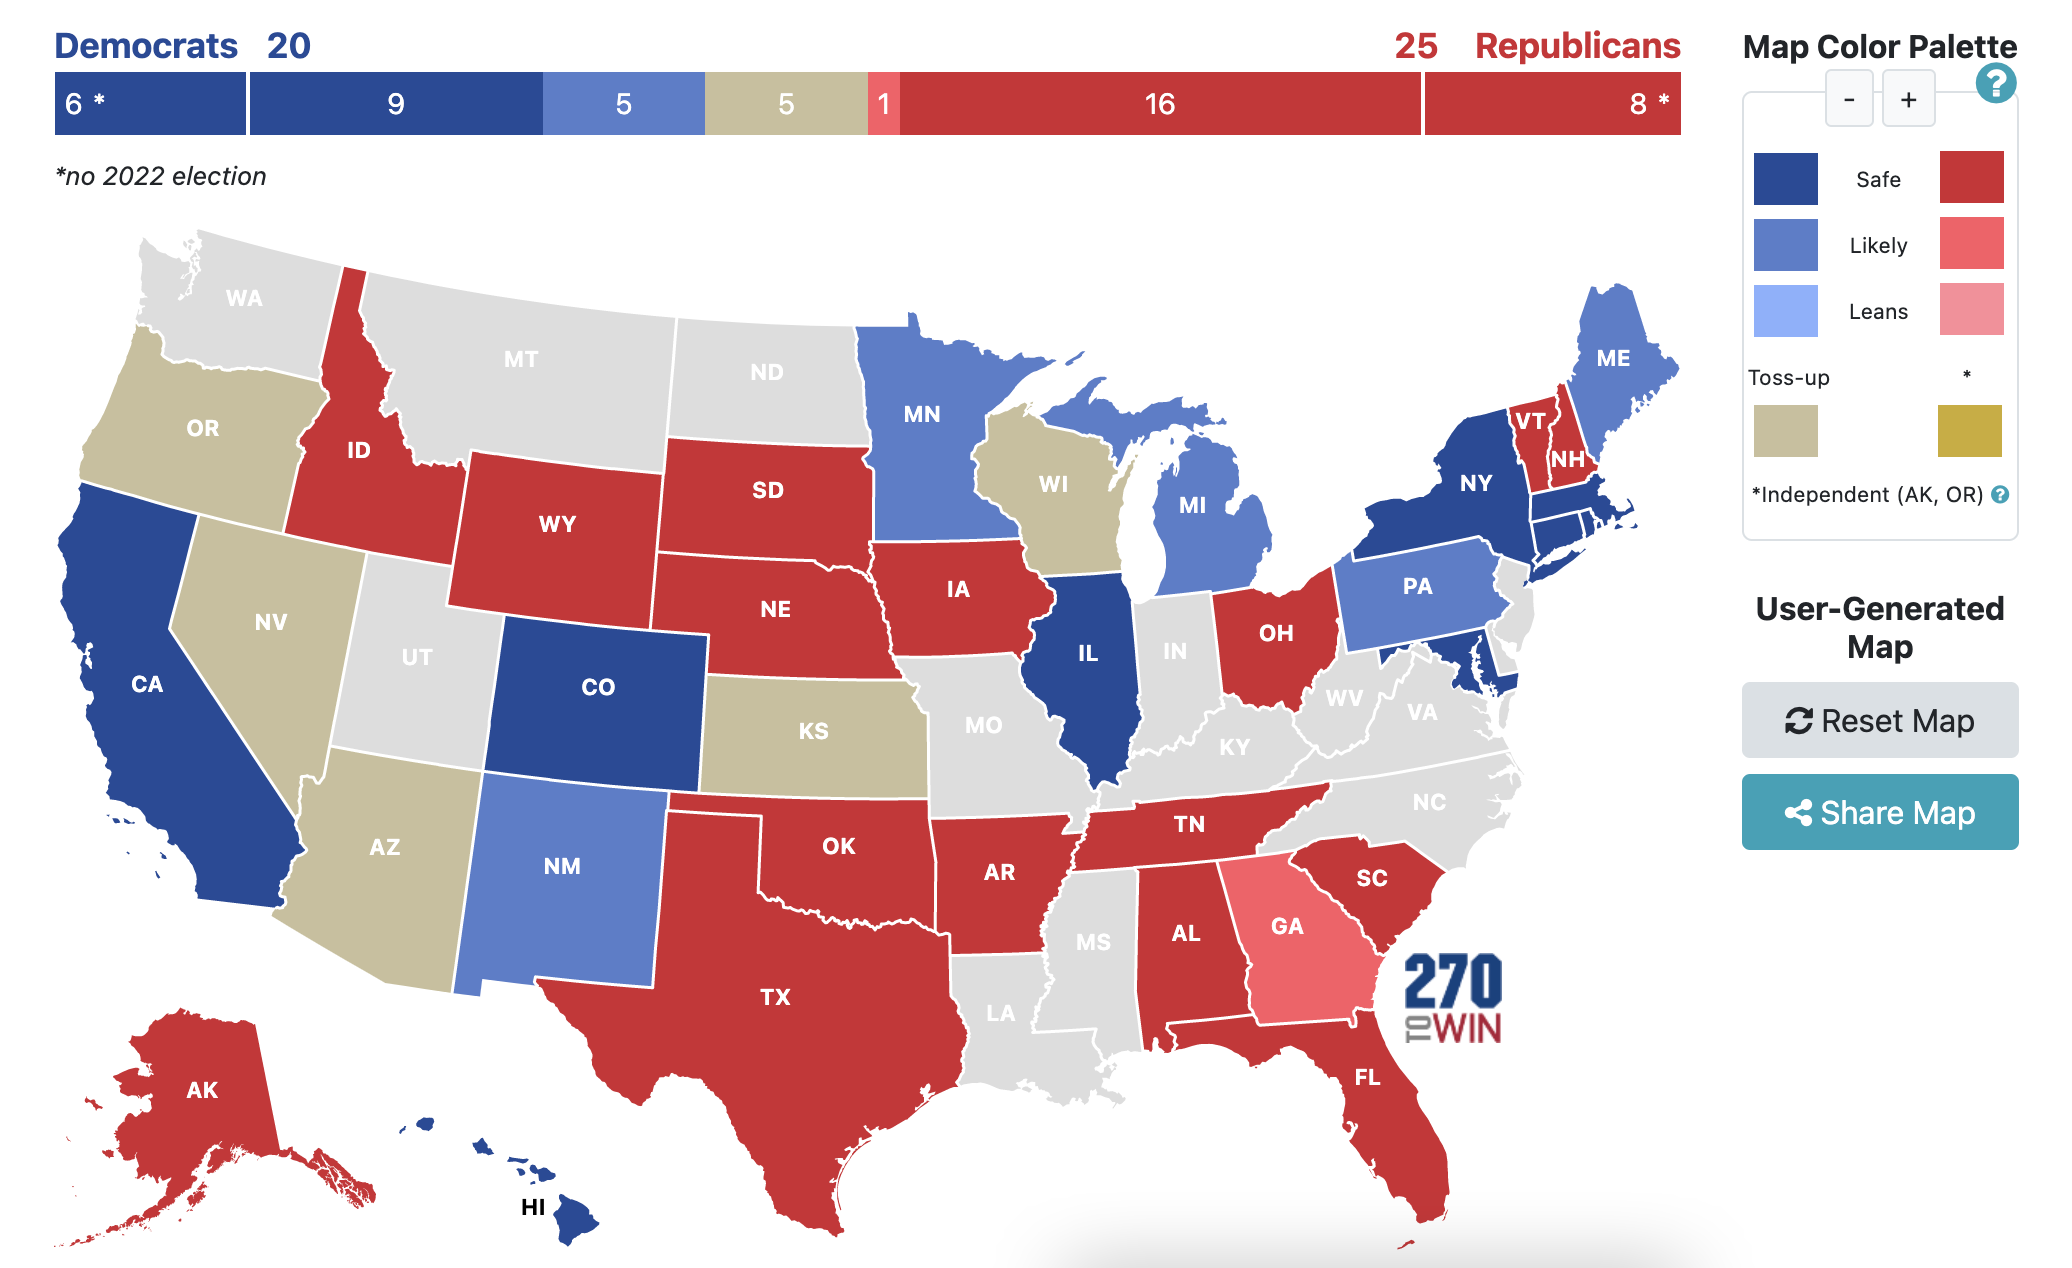
(Note: a typo in this graph previously incorrectly had South Dakota as "Likely R" instead of "Safe R")
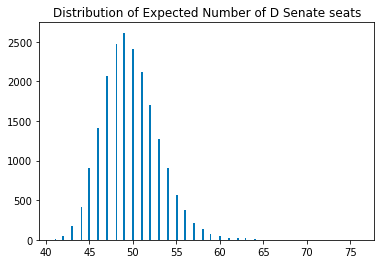
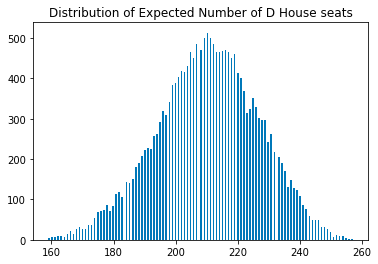
DISTRIBUTIONS:
- D Senate Seats 80% CI: 46 - 54 seats
- Median House outcome: 211 D House seats, 224 R House seats (Rs have 13 seat majority)
- D House Seats 80% CI: 189 - 231
- R House Seats 80% CI: 204 - 246
D SENATE SCENARIOS:
- 37% Democrats gain one or more Senate seats
- 12% there is net zero change of seats
- 13% Republicans gain net one seat
- 12% Republicans gain net two seats
- 25% Republicans gain net three or more seats
D HOUSE SCENARIOS:
- 29% Democrats net gain 0 or more house seats
- 5% Democrats net lose house seats but keep majority
- 9% Republicans have majority by <5 seats
- 22% Republicans have majority by 5-15 seats
- 19% Republicans have majority by 16-25 seats
- 17% Republicans have majority by >25 seats
GENERIC BALLOT ESTIMATE: R+0.7
SENATE SEAT DISTRIBUTION:
p(>=43 D Senate seats): 100%
p(>=44 D Senate seats): 99%
p(>=45 D Senate seats): 97%
p(>=46 D Senate seats): 92%
p(>=47 D Senate seats): 85%
p(>=48 D Senate seats): 75%
p(>=49 D Senate seats): 63%
p(>=50 D Senate seats): 50%
p(>=51 D Senate seats): 37%
p(>=52 D Senate seats): 27%
p(>=53 D Senate seats): 18%
p(>=54 D Senate seats): 12%
p(>=55 D Senate seats): 7%
p(>=56 D Senate seats): 5%
p(>=57 D Senate seats): 3%
p(>=58 D Senate seats): 2%
Expected Senate D win chance in each state:
- D wins FL Senate? -- Highly likely no (3% chance)
- D wins IA Senate? -- Likely no (5% chance)
- D wins OH Senate? -- Likely no (14% chance)
- D wins NC Senate? -- Likely no (15% chance)
- D wins WI Senate? -- Likely no (16% chance)
- D wins NV Senate? -- Unclear but slight no (42% chance)
- D wins GA Senate? -- Unclear but slight no (47% chance)
- D wins PA Senate? -- Unclear but slight yes (51% chance)
- D wins AZ Senate? -- Somewhat leaning yes (63% chance)
- D wins NH Senate? -- Somewhat leaning yes (75% chance)
- D wins CO Senate? -- Likely yes (86% chance)
- D wins WA Senate? -- Likely yes (90% chance)
Expected Senate margin in each state:
- IA: R+11.9 (80% CI: R+21.4 to R+2.5)
- FL: R+9.6 (80% CI: R+16.6 to R+2.7)
- OH: R+5.7 (80% CI: R+12.5 to D+1.1)
- WI: R+5.4 (80% CI: R+12.5 to D+1.8)
- NC: R+5.2 (80% CI: R+12 to D+1.5)
- NV: R+1.2 (80% CI: R+10.2 to D+7.7)
- GA: R+0.5 (80% CI: R+9.5 to D+8.6)
- PA: D+0.2 (80% CI: R+8.7 to D+9.1)
- AZ: D+2.1 (80% CI: R+5.9 to D+10)
- NH: D+5.6 (80% CI: R+4.8 to D+15.9)
- CO: D+8.2 (80% CI: R+1.2 to D+17.7)
- WA: D+11.2 (80% CI: D+0.4 to D+22)
Who wins House?
D win odds for my model's 30 most competitive House races
- D wins CO-8? -- Somewhat leaning no (35% chance)
- D wins NC-13? -- Somewhat leaning no (35% chance)
- D wins CA-22? -- Somewhat leaning no (37% chance)
- D wins NE-2? -- Somewhat leaning no (38% chance)
- D wins NJ-7? -- Somewhat leaning no (38% chance)
- D wins IA-3? -- Unclear but slight no (42% chance)
- D wins CA-27? -- Unclear but slight no (44% chance)
- D wins PA-7? -- Unclear but slight no (45% chance)
- D wins OH-13? -- Unclear but slight no (46% chance)
- D wins OH-1? -- Unclear but slight no (47% chance)
- D wins NY-22? -- Unclear but slight no (48% chance)
- D wins VA-2? -- Unclear but slight yes (50% chance)
- D wins IL-17? -- Unclear but slight yes (55% chance)
- D wins MI-3? -- Unclear but slight yes (55% chance)
- D wins NV-3? -- Unclear but slight yes (55% chance)
- D wins NY-19? -- Unclear but slight yes (56% chance)
- D wins MN-2? -- Unclear but slight yes (57% chance)
- D wins PA-17? -- Unclear but slight yes (58% chance)
- D wins PA-8? -- Unclear but slight yes (58% chance)
- D wins ME-2? -- Unclear but slight yes (58% chance)
- D wins OR-5? -- Unclear but slight yes (58% chance)
- D wins CA-13? -- Unclear but slight yes (59% chance)
- D wins MI-7? -- Unclear but slight yes (59% chance)
- D wins NY-3? -- Somewhat leaning yes (60% chance)
- D wins NV-1? -- Somewhat leaning yes (61% chance)
- D wins RI-2? -- Somewhat leaning yes (63% chance)
- D wins NV-4? -- Somewhat leaning yes (64% chance)
- D wins AK-1? -- Somewhat leaning yes (64% chance)
- D wins OH-9? -- Somewhat leaning yes (64% chance)
- D wins IN-1? -- Somewhat leaning yes (65% chance)
House Race Controversies
D win odds for the 30 House races I rate most differently than 538
- TX-15 -- My odds 13%, 538 odds 51%
- OH-13 -- My odds 46%, 538 odds 15%
- NE-2 -- My odds 38%, 538 odds 7%
- OH-1 -- My odds 48%, 538 odds 17%
- NY-22 -- My odds 49%, 538 odds 23%
- AZ-1 -- My odds 30%, 538 odds 5%
- CO-8 -- My odds 35%, 538 odds 10%
- NC-1 -- My odds 71%, 538 odds 95%
- TX-34 -- My odds 73%, 538 odds 49%
- IN-1 -- My odds 66%, 538 odds 86%
- OR-5 -- My odds 59%, 538 odds 39%
- OR-4 -- My odds 71%, 538 odds 90%
- AZ-4 -- My odds 75%, 538 odds 92%
- MT-1 -- My odds 23%, 538 odds 5%
- NV-4 -- My odds 64%, 538 odds 81%
- CA-49 -- My odds 69%, 538 odds 85%
- NM-3 -- My odds 83%, 538 odds 99%
- AK-1 -- My odds 65%, 538 odds 49%
- CA-41 -- My odds 21%, 538 odds 5%
- MN-2 -- My odds 58%, 538 odds 73%
- IA-1 -- My odds 21%, 538 odds 6%
- NM-1 -- My odds 83%, 538 odds 98%
- WA-3 -- My odds 17%, 538 odds 2%
- NC-6 -- My odds 83%, 538 odds 97%
- NC-13 -- My odds 36%, 538 odds 22%
- CA-3 -- My odds 17%, 538 odds 3%
- IL-11 -- My odds 82%, 538 odds 95%
- MI-7 -- My odds 60%, 538 odds 73%
- AZ-6 -- My odds 19%, 538 odds 6%
- FL-15 -- My odds 15%, 538 odds 2%
Governor Outcomes
- AK -- D wins?: Almost certainly no (1% chance) ---- Margin: R+13 (80% CI: R+18.3 to R+7.6)
- TX -- D wins?: Almost certainly no (1% chance) ---- Margin: R+12.9 (80% CI: R+19 to R+6.7)
- FL -- D wins?: Highly likely no (2% chance) ---- Margin: R+18.5 (80% CI: R+30.3 to R+6.8)
- OK -- D wins?: Highly likely no (2% chance) ---- Margin: R+12.5 (80% CI: R+20.6 to R+4.2)
- GA -- D wins?: Likely no (9% chance) ---- Margin: R+11.7 (80% CI: R+23.6 to Tie)
- KS -- D wins?: Unclear but slight no (44% chance) ---- Margin: R+0.8 (80% CI: R+10 to D+8.3)
- AZ -- D wins?: Unclear but slight no (46% chance) ---- Margin: R+0.6 (80% CI: R+9.1 to D+7.8)
- NV -- D wins?: Unclear but slight no (47% chance) ---- Margin: R+0.3 (80% CI: R+7.2 to D+6.6)
- OR -- D wins?: Unclear but slight no (48% chance) ---- Margin: R+0.1 (80% CI: R+6 to D+5.9)
- WI -- D wins?: Unclear but slight no (49% chance) ---- Margin: R+0.1 (80% CI: R+5.9 to D+5.7)
- ME -- D wins?: Likely yes (82% chance) ---- Margin: D+8.8 (80% CI: R+3.2 to D+20.7)
- NM -- D wins?: Likely yes (85% chance) ---- Margin: D+6 (80% CI: R+1.1 to D+13.2)
- MI -- D wins?: Likely yes (89% chance) ---- Margin: D+11.5 (80% CI: R+0.3 to D+23.2)
- MN -- D wins?: Likely yes (89% chance) ---- Margin: D+11.6 (80% CI: R+0.3 to D+23.4)
- PA -- D wins?: Likely yes (90% chance) ---- Margin: D+12.2 (80% CI: D+0.3 to D+24.1)
- RI -- D wins?: Highly likely yes (95% chance) ---- Margin: D+15.7 (80% CI: D+3.8 to D+27.6)
- NY -- D wins?: Almost certainly yes (98% chance) ---- Margin: D+12.4 (80% CI: D+4.7 to D+20.1)
- CT -- D wins?: Almost certainly yes (99% chance) ---- Margin: D+12.8 (80% CI: D+6.8 to D+18.8)
Methods
- My model mainly (but not entirely) relies on aggregating models from FiveThirtyEight, @iabvek, Split Ticket, Sabato's Crystal Ball, and Cory McCartan. The Senate model also pulls from PredictIt and Polymarket. Combining models is likely more accurate than an individual model.
- I think compared to FiveThirtyEight, this model relies much more on fundamentals (mainly past vote margin + demographic trends + incumbency + subjective assessments of candidate quality) and less on polling.
- I have some skin in the game as I have made some bets on these models. I'd be potentially interested in making more. I'm not currently using prediction markets due to their lack of legal status in the United States.
- I mainly made this model to practice forecasting skills, as I am excited to make difficult forecasts in an area that gives fast feedback.
- Depending on how well this model does on election day, I may write more detail.
~
Here's a spreadsheet that compares the outputs of the various models.