Final predictions for the 2022 US midterm elections

OVERALL:
- Dem Senate control -- Unclear but slight no (46% chance)
- Dem House control -- Somewhat leaning no (27% chance)
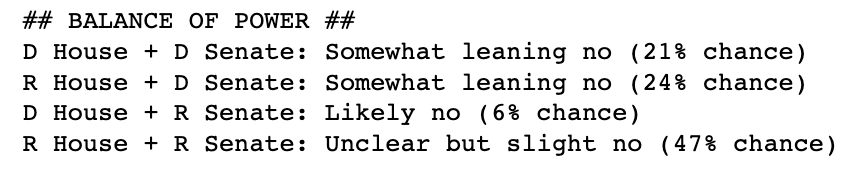
BALANCE OF POWER:
- D House + D Senate: Somewhat leaning no (21% chance)
- R House + D Senate: Somewhat leaning no (24% chance)
- D House + R Senate: Likely no (6% chance)
- R House + R Senate: Unclear but slight no (47% chance)
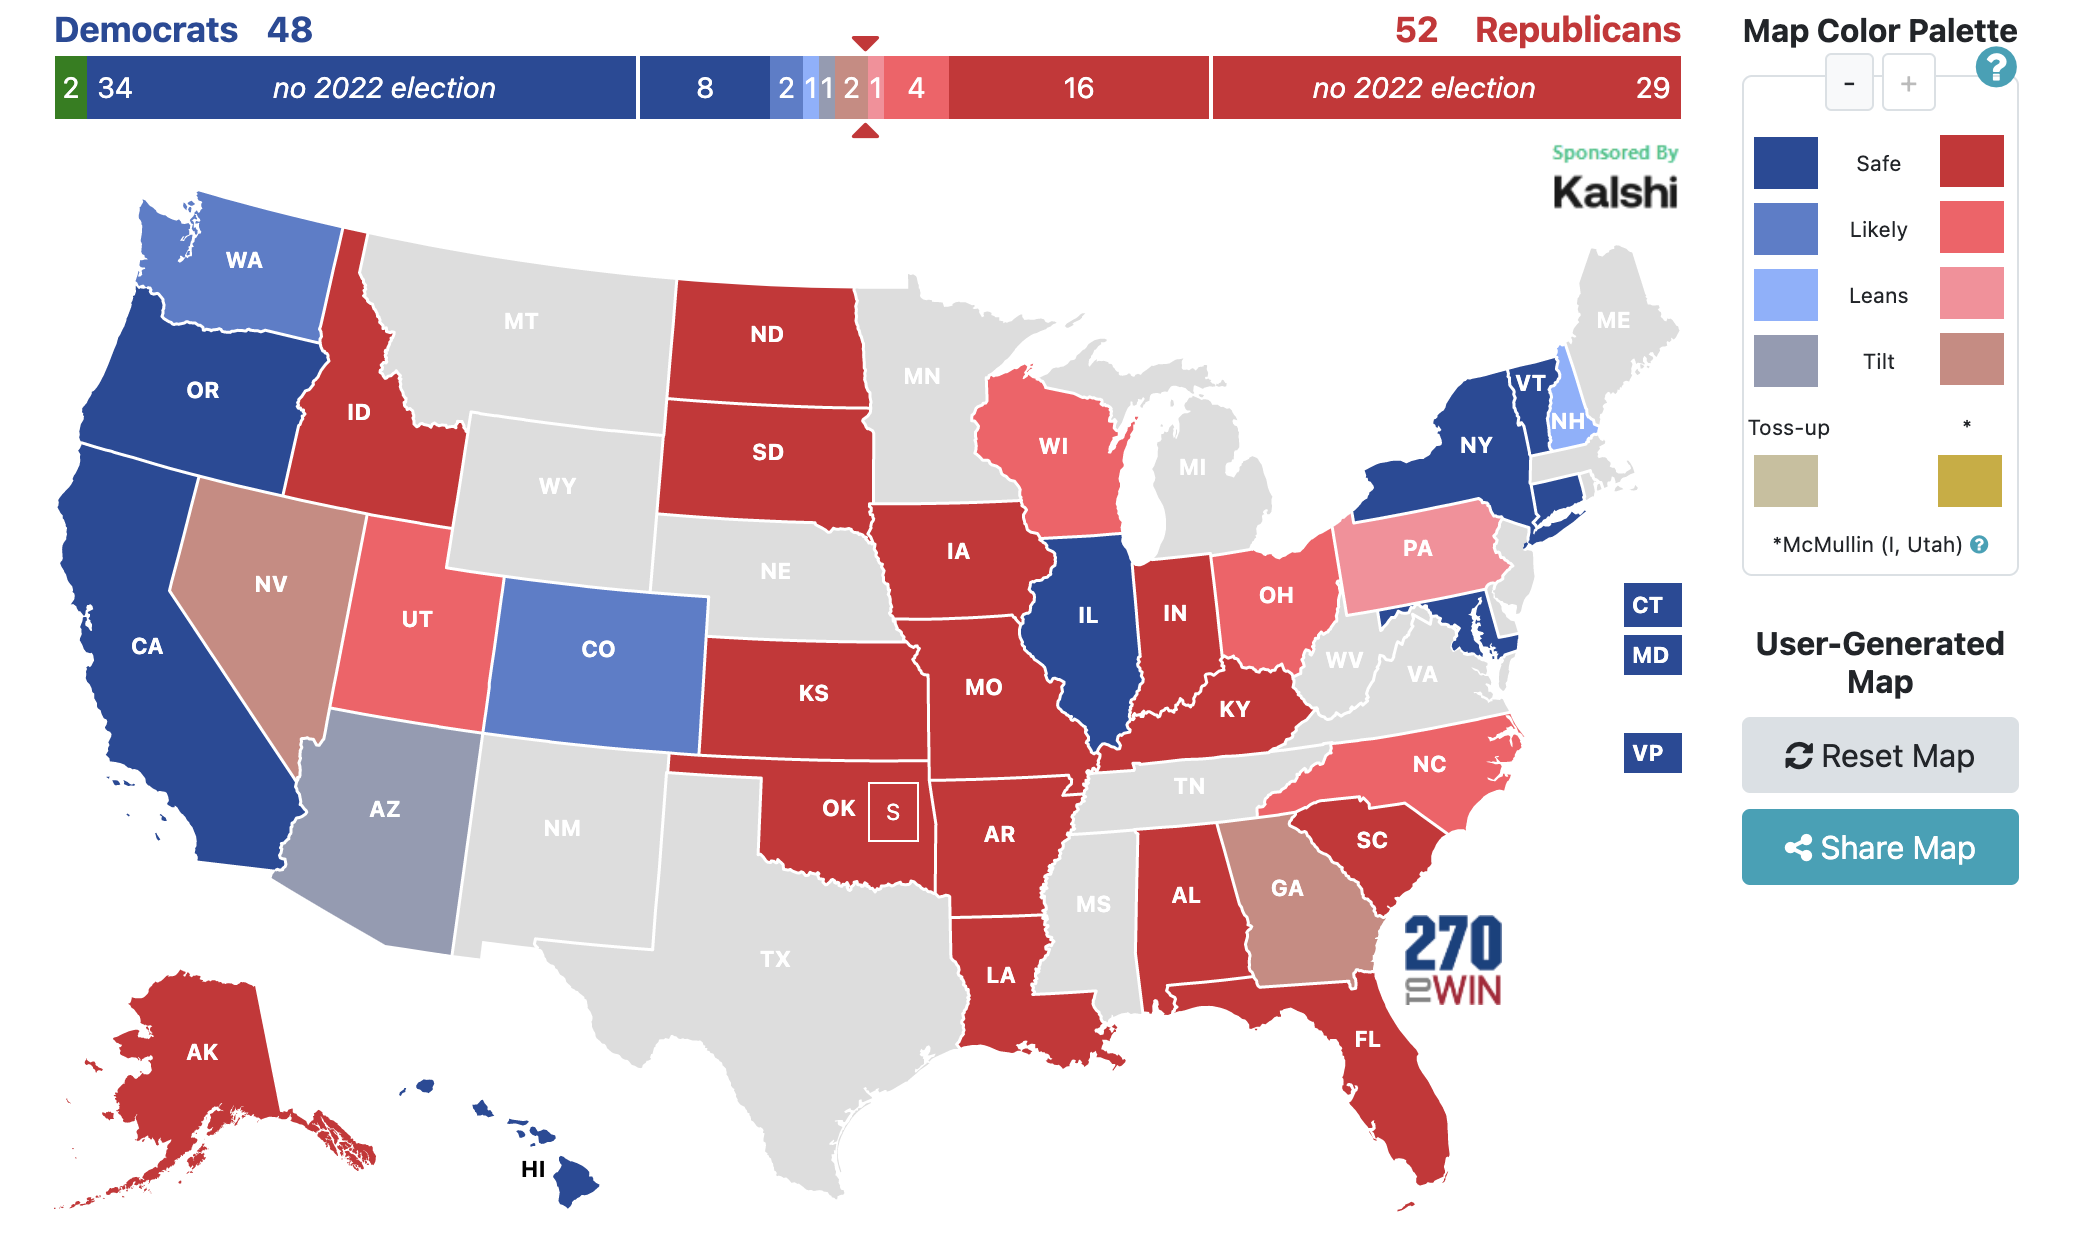
MAPS:
Senate
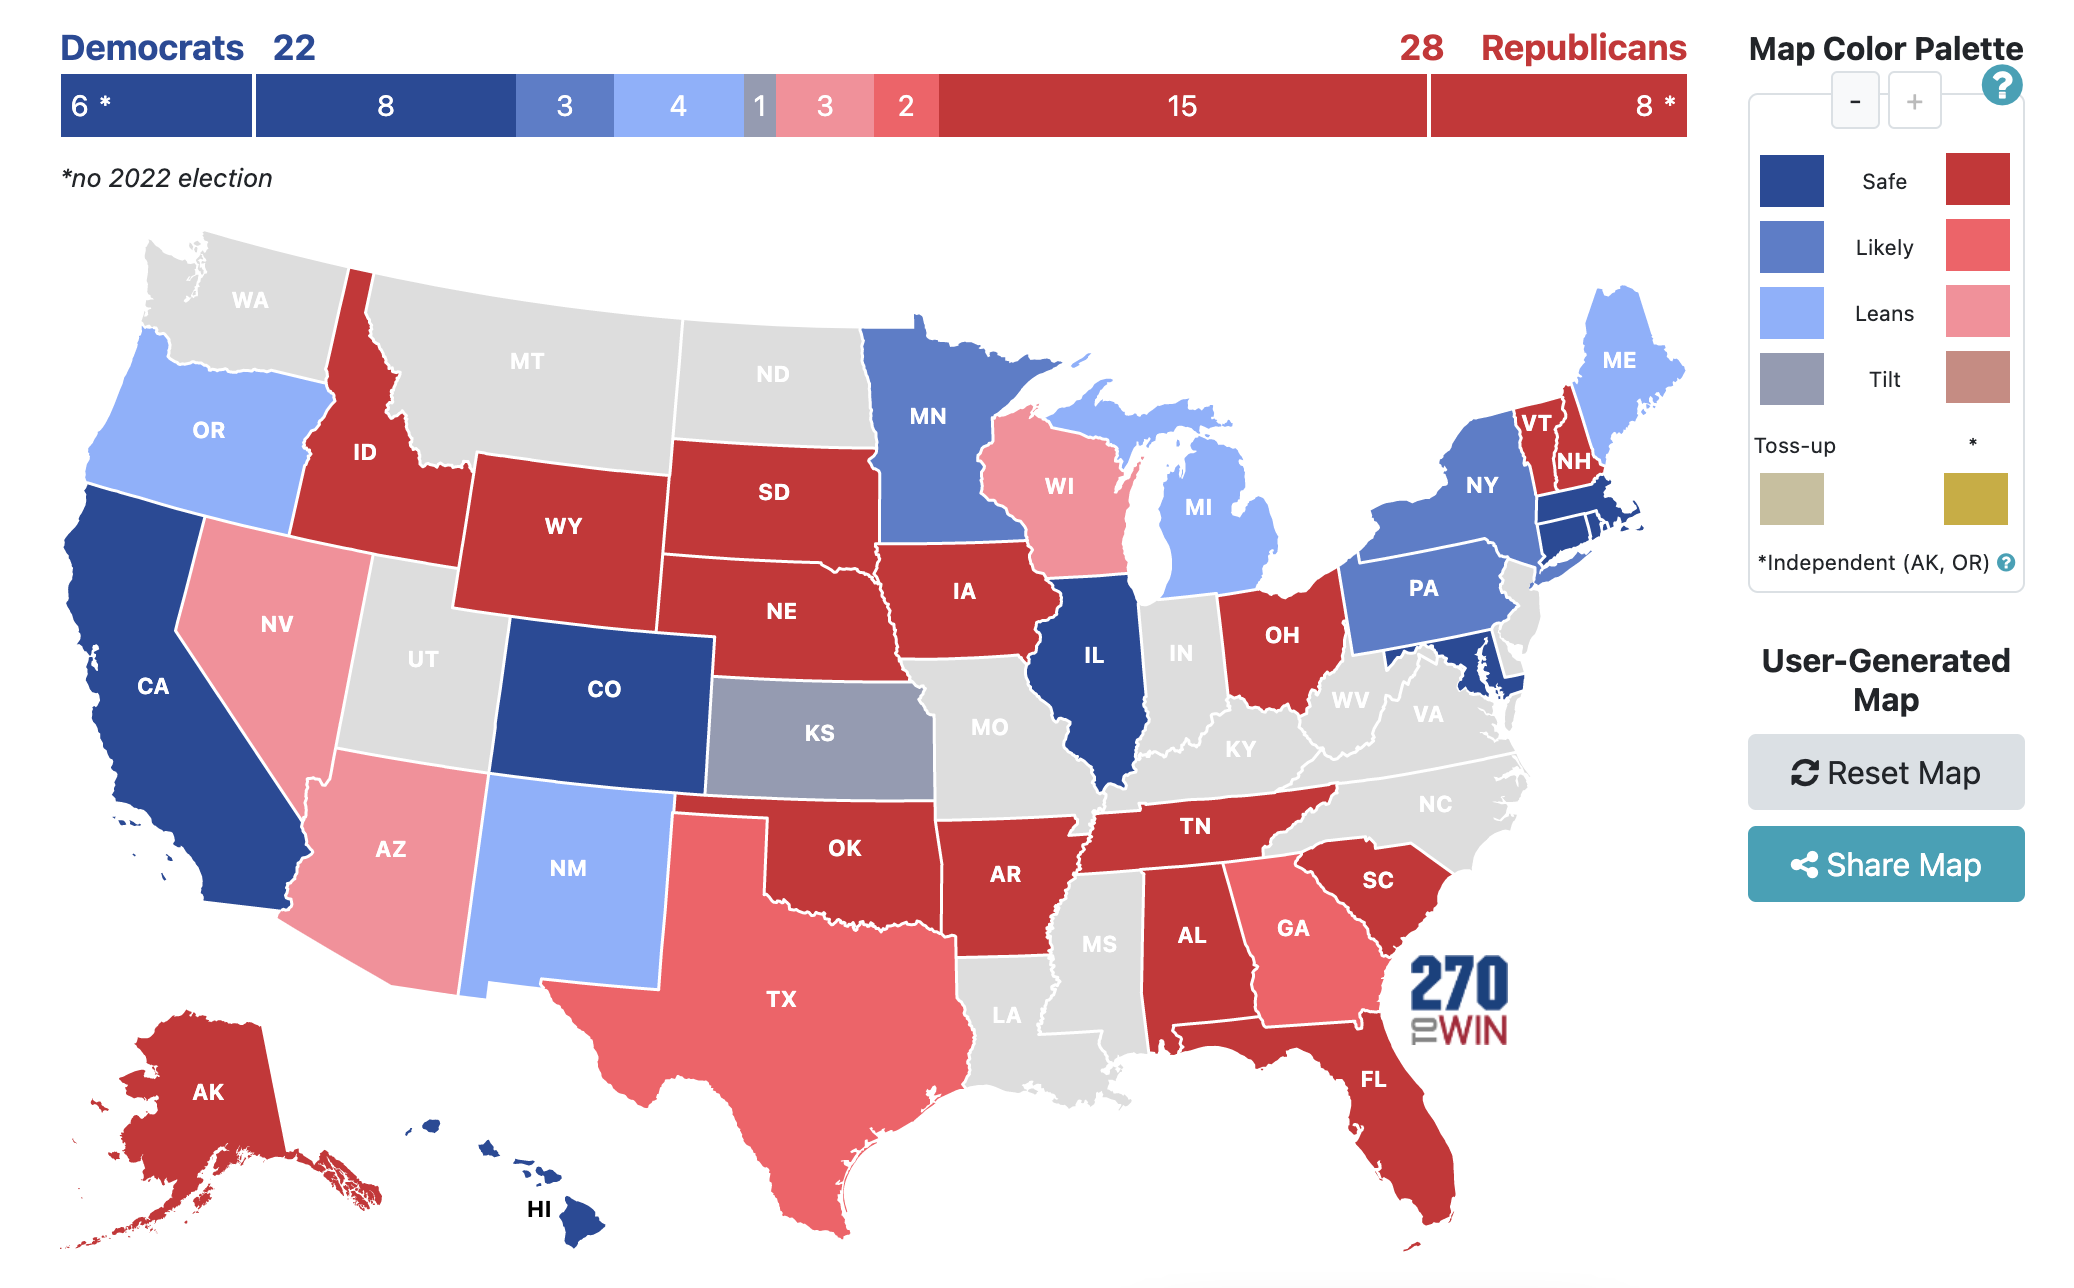
Governor
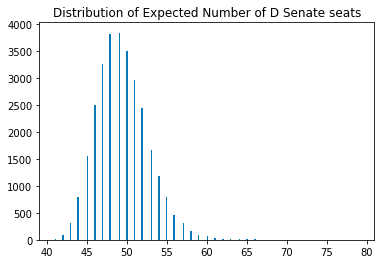
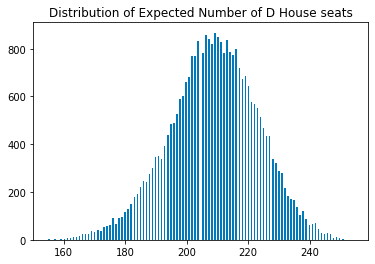
DISTRIBUTIONS:
- D Senate Seats 80% CI: 46 - 54 seats
- Median House outcome: 209 D House seats, 226 R House seats (Rs have 17 seat majority)
- D House Seats 80% CI: 190 - 227
- R House Seats 80% CI: 208 - 245
D SENATE SCENARIOS:
- 34% Democrats gain one or more Senate seats
- 12% there is net zero change of seats
- 13% Republicans gain net one seat
- 13% Republicans gain net two seats
- 28% Republicans gain net three or more seats
D HOUSE SCENARIOS:
- 23% Democrats net gain 0 or more house seats
- 5% Democrats net lose house seats but keep majority
- 10% Republicans have majority by <5 seats
- 25% Republicans have majority by 5-15 seats
- 21% Republicans have majority by 16-25 seats
- 16% Republicans have majority by >25 seats
GENERIC BALLOT ESTIMATE: R+0.7
SENATE SEAT DISTRIBUTION:
- 46 or fewer GOP Senate seats: 11%
- 47 GOP seats: 6%
- 48 GOP seats: 8%
- 49 GOP seats: 10%
- 50 GOP seats: 12%
- 51 GOP seats: 13%
- 52 GOP seats: 13%
- 53 GOP seats: 11%
- 54 GOP seats: 8%
- 55 GOP seats: 5%
- 56 or more GOP seats: 4%
Expected Senate D win chance in each state:
- D wins FL Senate? -- Highly likely no (2% chance)
- D wins IA Senate? -- Highly likely no (3% chance)
- D wins OH Senate? -- Likely no (11% chance)
- D wins NC Senate? -- Likely no (16% chance)
- D wins WI Senate? -- Likely no (18% chance)
- D wins PA Senate? -- Somewhat leaning no (39% chance)
- D wins NV Senate? -- Unclear but slight no (42% chance)
- D wins GA Senate? -- Unclear but slight no (44% chance) (note: will likely go into runoff)
- D wins AZ Senate? -- Somewhat leaning yes (58% chance)
- D wins NH Senate? -- Somewhat leaning yes (70% chance)
- D wins CO Senate? -- Likely yes (90% chance)
- D wins WA Senate? -- Likely yes (93% chance)
Expected Senate margin in each state:
- IA: R+11.8 (80% CI: R+20 to R+3.5)
- FL: R+11.5 (80% CI: R+18.8 to R+4.4)
- OH: R+6.3 (80% CI: R+13 to D+0.5)
- NC: R+4.8 (80% CI: R+11.1 to D+1.4)
- WI: R+4.7 (80% CI: R+11.5 to D+2)
- PA: R+1.6 (80% CI: R+9.9 to D+6.7)
- NV: R+1.5 (80% CI: R+11.5 to D+8.5)
- GA: R+0.9 (80% CI: R+9.3 to D+7.6)
- AZ: D+1.2 (80% CI: R+6.3 to D+8.6)
- NH: D+4.1 (80% CI: R+5.7 to D+13.7)
- CO: D+9.2 (80% CI: D+0.1 to D+18.3)
- WA: D+12.2 (80% CI: D+1.9 to D+22.5)
Who wins House?
D win odds for my model's 30 most competitive House races
- D wins CO-8? -- Somewhat leaning no (26% chance)
- D wins NM-2? -- Somewhat leaning no (31% chance)
- D wins PA-7? -- Somewhat leaning no (33% chance)
- D wins NC-13? -- Somewhat leaning no (34% chance)
- D wins NE-2? -- Somewhat leaning no (35% chance)
- D wins IA-3? -- Somewhat leaning no (35% chance)
- D wins OH-13? -- Somewhat leaning no (36% chance)
- D wins VA-2? -- Somewhat leaning no (39% chance)
- D wins OH-1? -- Unclear but slight no (42% chance)
- D wins NV-3? -- Unclear but slight no (44% chance)
- D wins NY-19? -- Unclear but slight no (45% chance)
- D wins OR-5? -- Unclear but slight no (49% chance)
- D wins NY-22? -- Unclear but slight yes (50% chance)
- D wins PA-17? -- Unclear but slight yes (51% chance)
- D wins IL-17? -- Unclear but slight yes (52% chance)
- D wins CA-27? -- Unclear but slight yes (52% chance)
- D wins MI-7? -- Unclear but slight yes (54% chance)
- D wins CA-22? -- Unclear but slight yes (55% chance)
- D wins CT-5? -- Unclear but slight yes (56% chance)
- D wins RI-2? -- Unclear but slight yes (56% chance)
- D wins PA-8? -- Unclear but slight yes (58% chance)
- D wins CA-13? -- Somewhat leaning yes (60% chance)
- D wins NY-3? -- Somewhat leaning yes (61% chance)
- D wins NV-1? -- Somewhat leaning yes (63% chance)
- D wins NV-4? -- Somewhat leaning yes (68% chance)
- D wins WA-8? -- Somewhat leaning yes (69% chance)
- D wins ME-2? -- Somewhat leaning yes (70% chance)
- D wins OH-9? -- Somewhat leaning yes (71% chance)
- D wins IN-1? -- Somewhat leaning yes (71% chance)
- D wins TX-34? -- Somewhat leaning yes (73% chance)
House Race Controversies
D win odds for the 30 House races I rate most differently than 538
- TX-15 -- My odds 13%, 538 odds 54%
- NE-2 -- My odds 35%, 538 odds 8%
- OH-1 -- My odds 42%, 538 odds 16%
- TX-34 -- My odds 73%, 538 odds 48%
- IL-6 -- My odds 92%, 538 odds 67%
- AK-1 -- My odds 74%, 538 odds 50%
- MI-3 -- My odds 80%, 538 odds 59%
- NC-1 -- My odds 76%, 538 odds 96%
- AZ-2 -- My odds 14%, 538 odds 34%
- IN-1 -- My odds 72%, 538 odds 91%
- OH-13 -- My odds 37%, 538 odds 19%
- NV-3 -- My odds 44%, 538 odds 62%
- CO-8 -- My odds 26%, 538 odds 9%
- CA-22 -- My odds 56%, 538 odds 39%
- AZ-1 -- My odds 21%, 538 odds 5%
- CA-27 -- My odds 53%, 538 odds 37%
- NY-17 -- My odds 86%, 538 odds 70%
- MD-6 -- My odds 87%, 538 odds 72%
- NV-4 -- My odds 69%, 538 odds 83%
- NY-22 -- My odds 50%, 538 odds 36%
- IL-14 -- My odds 91%, 538 odds 78%
- NY-19 -- My odds 46%, 538 odds 58%
- NC-13 -- My odds 35%, 538 odds 23%
- NJ-3 -- My odds 96%, 538 odds 85%
- CA-47 -- My odds 90%, 538 odds 80%
- MI-7 -- My odds 55%, 538 odds 65%
- PA-7 -- My odds 34%, 538 odds 44%
- NV-1 -- My odds 63%, 538 odds 53%
- IL-17 -- My odds 52%, 538 odds 62%
- NY-4 -- My odds 87%, 538 odds 78%
Governor Outcomes
- AK -- D wins?: Almost certainly no (1% chance) ---- Margin: R+9.9 (80% CI: R+14 to R+5.9)
- FL -- D wins?: Highly likely no (3% chance) ---- Margin: R+14.5 (80% CI: R+24.8 to R+4.2)
- OK -- D wins?: Highly likely no (4% chance) ---- Margin: R+9.9 (80% CI: R+17.6 to R+2.3)
- TX -- D wins?: Likely no (6% chance) ---- Margin: R+12.4 (80% CI: R+22.7 to R+2.1)
- GA -- D wins?: Likely no (11% chance) ---- Margin: R+9.8 (80% CI: R+20.1 to D+0.7)
- AZ -- D wins?: Somewhat leaning no (24% chance) ---- Margin: R+2.8 (80% CI: R+8 to D+2.4)
- NV -- D wins?: Somewhat leaning no (29% chance) ---- Margin: R+2.6 (80% CI: R+8.6 to D+3.4)
- WI -- D wins?: Somewhat leaning no (36% chance) ---- Margin: R+2.1 (80% CI: R+9.7 to D+5.6)
- KS -- D wins?: Unclear but slight yes (51% chance) ---- Margin: D+0.3 (80% CI: R+10.1 to D+10.6)
- OR -- D wins?: Somewhat leaning yes (67% chance) ---- Margin: D+2 (80% CI: R+3.6 to D+7.7)
- NM -- D wins?: Somewhat leaning yes (75% chance) ---- Margin: D+5.5 (80% CI: R+4.9 to D+15.9)
- MI -- D wins?: Somewhat leaning yes (76% chance) ---- Margin: D+5.9 (80% CI: R+4.4 to D+16.2)
- ME -- D wins?: Somewhat leaning yes (79% chance) ---- Margin: D+6.6 (80% CI: R+3.6 to D+16.9)
- MN -- D wins?: Likely yes (89% chance) ---- Margin: D+8.6 (80% CI: R+0.3 to D+17.6)
- NY -- D wins?: Likely yes (89% chance) ---- Margin: D+8.5 (80% CI: R+0.2 to D+17.1)
- PA -- D wins?: Likely yes (92% chance) ---- Margin: D+9.2 (80% CI: D+0.9 to D+17.5)
- CT -- D wins?: Highly likely yes (96% chance) ---- Margin: D+15 (80% CI: D+4.6 to D+25.3)
- RI -- D wins?: Highly likely yes (97% chance) ---- Margin: D+15.9 (80% CI: D+5.6 to D+26.3)
Methods
- My model mainly (but not entirely) relies on aggregating models from FiveThirtyEight, @iabvek, Split Ticket, Sabato's Crystal Ball, and Cory McCartan. The Senate model also pulls from PredictIt and Polymarket. Combining models is likely more accurate than an individual model.
- I think compared to FiveThirtyEight, this model relies much more on fundamentals (mainly past vote margin + demographic trends + incumbency + subjective assessments of candidate quality) and less on polling.
- I have skin in the game - I have bet over $2000 on these models.
- I mainly made this model to practice forecasting skills, as I am excited to make difficult forecasts in an area that gives fast feedback.
- Depending on how well this model does on election day, I may write more detail.
~
Here's a spreadsheet that compares the outputs of the various models.